📊 Marketing Metrics That Matter: Mastering ROAS, CPA, CTR & More

If you’re running performance campaigns, you must go beyond just traffic and impressions. To drive profitable growth, you need to measure what truly matters: revenue efficiency, user behavior, and conversion cost.
This blog breaks down the most critical marketing formulas and concepts every growth marketer, media buyer, or digital analyst should know — with use-cases, SQL examples, and actionable insights.
🚀 1. ROAS: Return on Ad Spend
Formula:ROAS = Revenue ÷ Ad Spend
Use Case:
ROAS tells you how much revenue you generate for every ₹1 you spend on ads.
Example:
If you spend ₹50,000 and make ₹2,00,000, your ROAS is 4.0 — meaning you’re earning 4x return. A ROAS > 3 is typically healthy, but varies by industry.
🎯 2. CPA: Cost Per Acquisition
Formula:CPA = Spend ÷ Conversions
Use Case:
Lower CPA = more efficient campaigns. Use this to optimize bidding, creatives, and audience targeting.
Example:
₹10,000 spent for 50 conversions = ₹200 CPA. If your product profit margin is ₹500, you’re in the green.
📈 3. CTR vs. CR: Understand the Funnel
Click-Through Rate (CTR)CTR = Clicks ÷ Impressions
👉 Use to measure how compelling your ad creative is.
Conversion Rate (CR)CR = Conversions ÷ Clicks
👉 Use to evaluate landing page performance.
Tip: High CTR + low CR? Your page isn’t aligned with your ad promise. Low CTR? Tweak copy and visuals.
💸 4. LTV:CAC Ratio
Ideal Benchmark:> 3:1
Meaning:
If your Customer Lifetime Value (LTV) is ₹3,000 and Customer Acquisition Cost (CAC) is ₹1,000, your ratio is 3:1 — which means long-term profits.
This ratio signals sustainable growth. Anything below 1:1? You’re losing money.
🧪 5. A/B Testing & Statistical Significance
- Type I Error: False positive (detecting a win when there’s none)
- Type II Error: False negative (missing a real win)
Best Practice:
- Use p < 0.05 to validate winning variants
- Ensure enough sample size, duration, and confidence interval before declaring a winner
📉 6. High Bounce Rate = Red Flag
If users leave after visiting just one page, it could mean:
- Poor load speed
- Content mismatch
- Irrelevant targeting
Fix it with: faster UX, better targeting, and stronger page-message alignment.
🧭 7. Attribution Models: Linear vs. Time Decay
- Linear: Equal credit across all touchpoints (great for B2B or long journeys)
- Time Decay: More credit to recent clicks (ideal for fast conversion cycles)
Choose your model based on buying journey complexity.
🧠 8. Smart SQL Tricks
🧮 Avoid Divide-by-Zero Errors:
sqlCopyEditspend / NULLIF(conversions, 0)
🥇 Rank Channels by ROI:
sqlCopyEditSELECT channel, SUM(revenue)/SUM(spend) AS roi
FROM campaign_data
GROUP BY channel
ORDER BY roi DESC;
📉 Drop-off Rate:
formulaCopyEditDrop-Off Rate = 1 - (Next Step ÷ Previous Step)
📊 Rolling Averages:
sqlCopyEditAVG(metric) OVER (ORDER BY date ROWS BETWEEN 6 PRECEDING AND CURRENT ROW)
🪙 9. CPM vs. CPC
- CPM (Cost per 1000 Impressions): Ideal for brand awareness
- CPC (Cost per Click): Ideal for engagement
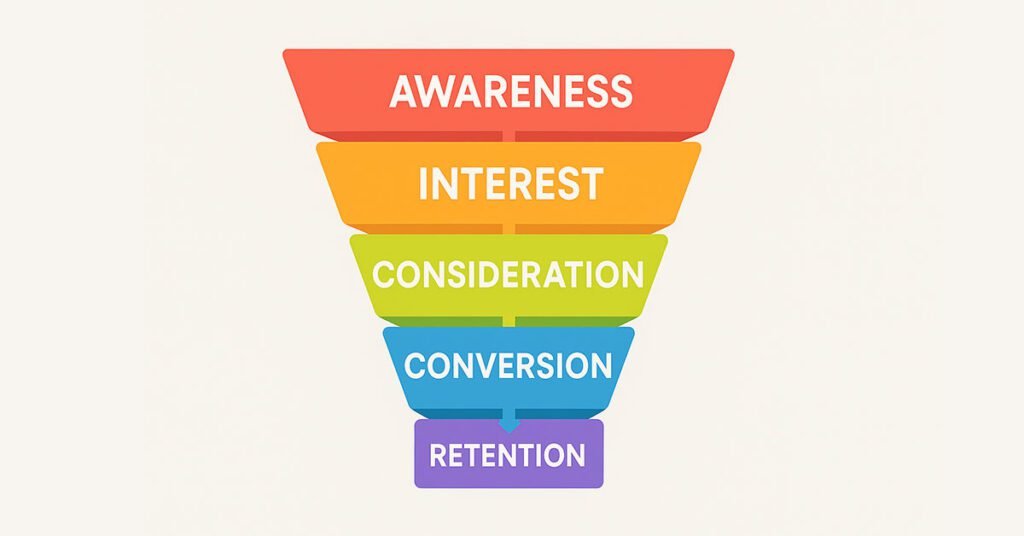
💡 Awareness stage? Focus on CPM. Bottom-funnel campaigns? Optimize for CPC or CPA.
🎯 10. Best Metric for Retargeting
Use CPA or ROAS when evaluating retargeting campaigns. Why?
Because retargeting is about efficiency — you’re engaging warm leads, so conversions should cost less and return more.
📊 11. GA4 Engagement Rate
Formula:= (Engaged Sessions ÷ Total Sessions) × 100
GA4 defines an engaged session as:
- 10 seconds,
- OR 2+ pageviews,
- OR conversion.
Engagement rate replaces bounce rate in GA4 and tells you who’s really interacting.
📈 12. Scaling with Rising CPA?
Still worth it if LTV is strong and you’re in a growth phase.
📌 Example: A funded startup may increase spend despite rising CPA — as long as total profit and user base grow faster than the cost.
🔍 13. UTM Parameters for Deep Tracking
Track:
- Source (e.g., Google)
- Medium (e.g., CPC)
- Campaign (e.g., Summer_Sale)
- Content / Keyword
Analyze UTM data in GA4, Looker Studio, or CRM to see which campaigns are working.
⚖️ 14. Interpreting p-value = 0.06
This is not statistically significant under the standard p < 0.05.
⚠️ Caution: You’re seeing a trend, not a proven result. It’s a “maybe,” not a “yes.”
💰 15. Channel Budgeting in Blended Campaigns
Don’t guess — use:
- Incrementality: Measure what wouldn’t have happened without this channel
- Marginal ROAS: What’s the return on the next ₹1 spent?
👉 Allocate more budget to high marginal ROI channels.
🎥 Bonus: Use STAR Format for Video Case Studies
- Situation: What was the campaign goal?
- Task: What did you aim to achieve (e.g., +20% CR)?
- Action: What strategies did you implement?
- Result: Show real metrics — ROAS 4.2, CPA dropped 35%, CR +25%
🎯 Use this for pitch decks, video case studies, or client onboarding.
✅ Final Takeaway
The smartest marketers aren’t just creative — they’re data-driven decision makers.
Understanding these formulas will help you:
- Spend smarter
- Optimize faster
- Scale profitably
🧠 Bookmark this guide. Share it with your team. And next time you look at campaign results, go beyond vanity metrics — look for efficiency, scale, and predictable growth.
Disclaimer
This content is AI-altered, based on generic insights and publicly available resources. It is not copied. Please verify independently before taking action. If you believe any content needs review, kindly raise a request — we’ll address it promptly to avoid any concerns.


